SEBI Registration No - INH300009914


Mastering Candlestick Patterns: A Must-Know for Every Indian Trader

In the fast-paced world of the Indian stock market, traders are constantly seeking an edge. Whether you’re a seasoned investor or a beginner looking to dip your toes into trading, understanding candlestick patterns can be a game-changer. These visual cues provide invaluable insights into market sentiment, helping traders make informed decisions and maximize profits. As a SEBI registered research analyst, it’s my pleasure to guide you through the fascinating world of candlestick patterns.
What Are Candlestick Patterns?
Candlestick patterns are a form of technical analysis used to forecast price movements based on past trading patterns. Each candlestick represents one period of trading data, typically a day for daily charts. These patterns are formed by the open, high, low, and close prices of a security within a specific timeframe.
Why Are They Important
Candlestick patterns offer traders a glimpse into market psychology. By studying the patterns formed by the candles, traders can interpret the ongoing battle between bulls and bears. This insight helps them anticipate potential reversals, breakouts, or continuations in price trends.
Common Candlestick Patterns Every Trader Should Know:
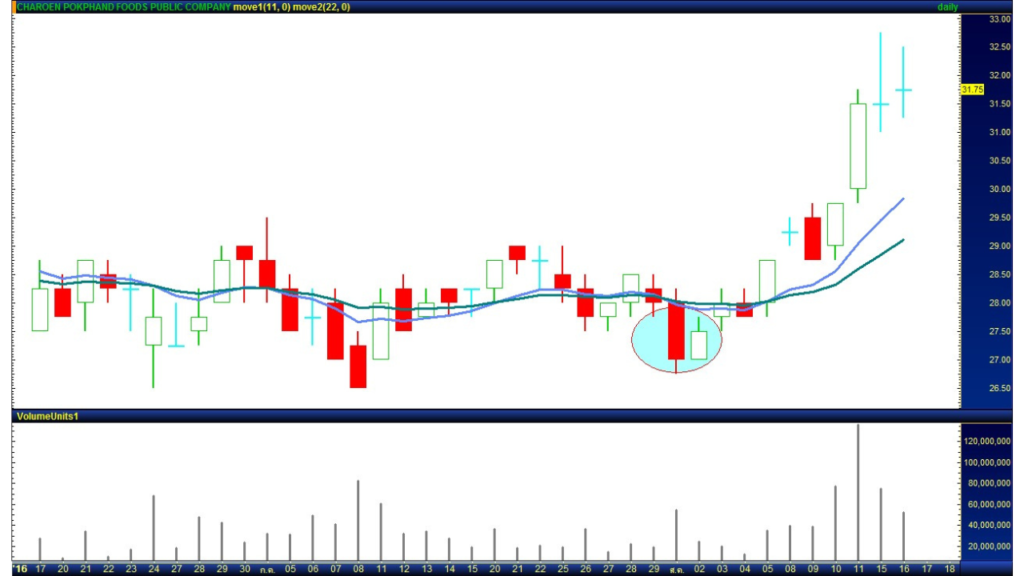
1. Doji:
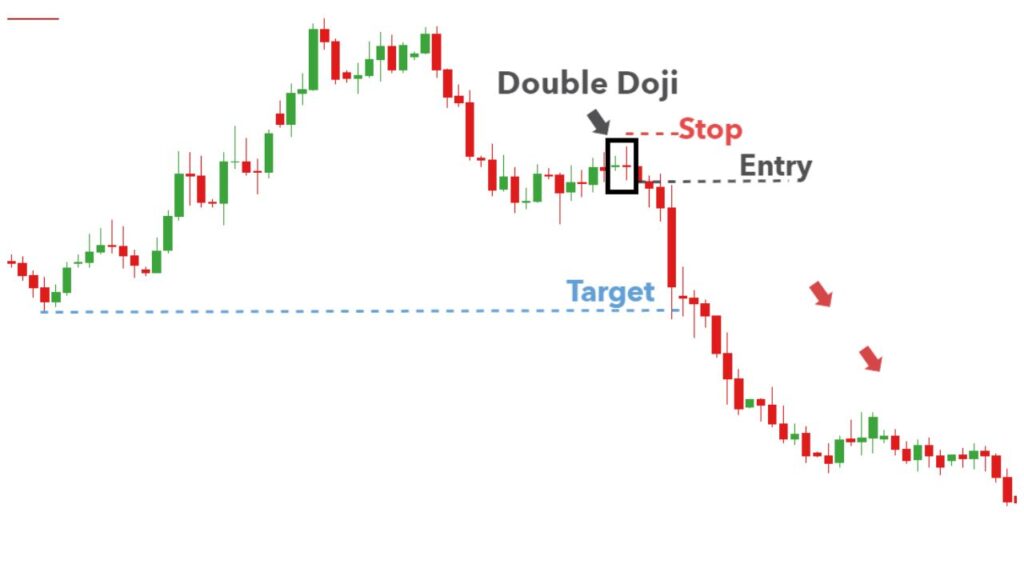
A Doji occurs when the open and close prices are virtually the same. It indicates indecision in the market and often precedes a reversal.
2. Hammer:
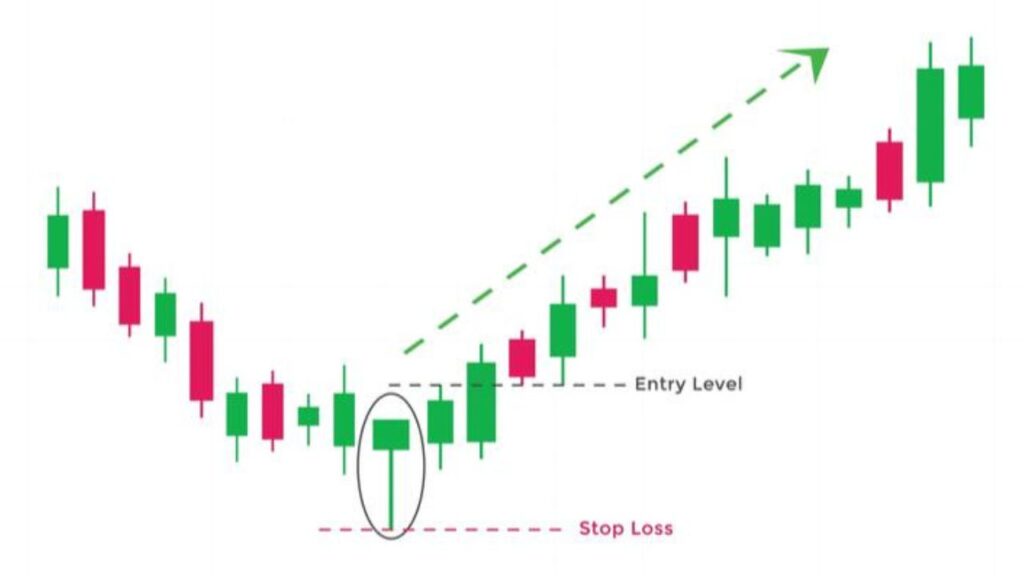
This pattern forms when the price falls significantly during the day but rallies to close near its opening price. It suggests a potential reversal to the upside.
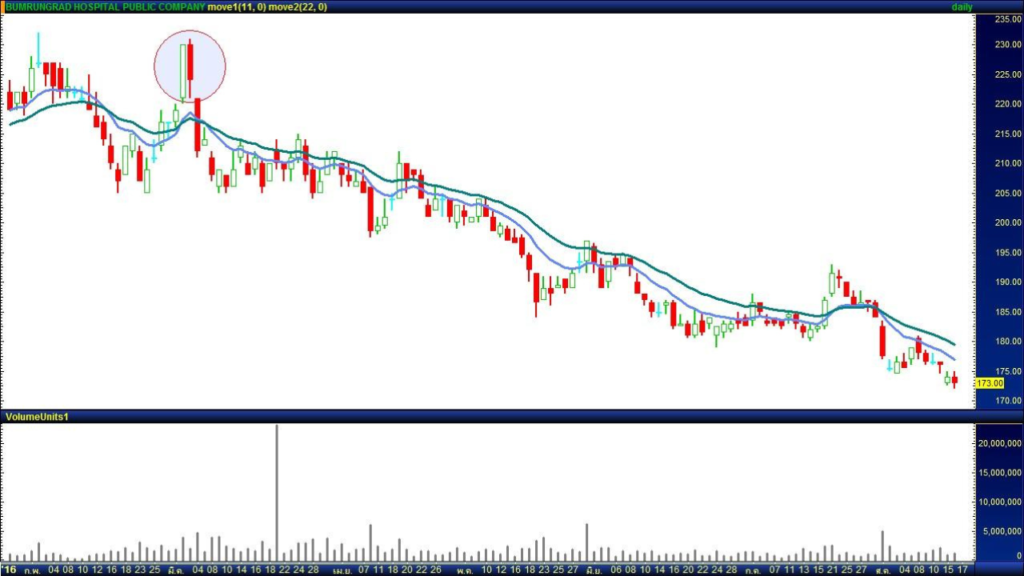
3. Shooting Star:
The Shooting Star appears when the price rises significantly during the day but closes near its low. It signals a potential reversal to the downside.
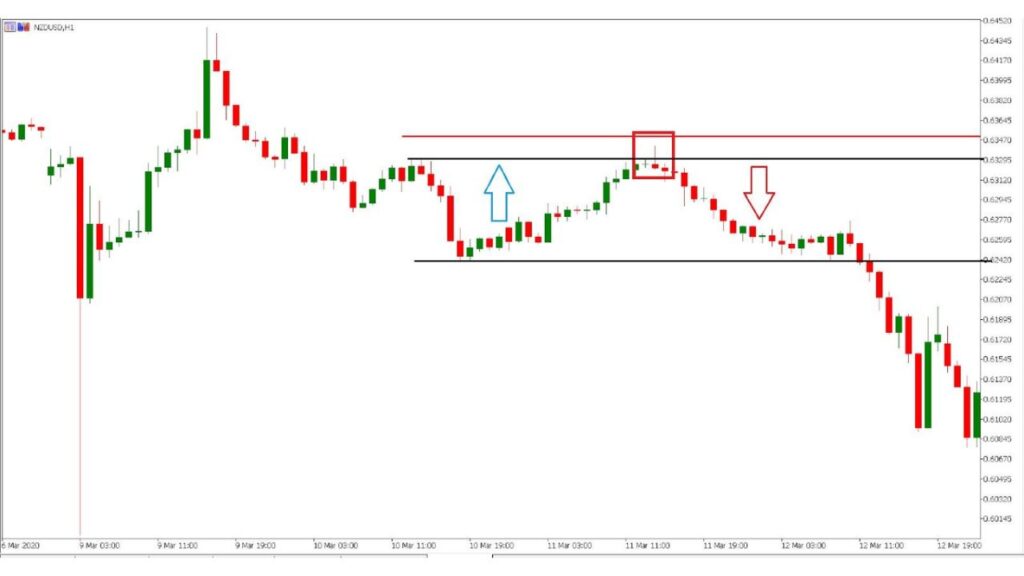
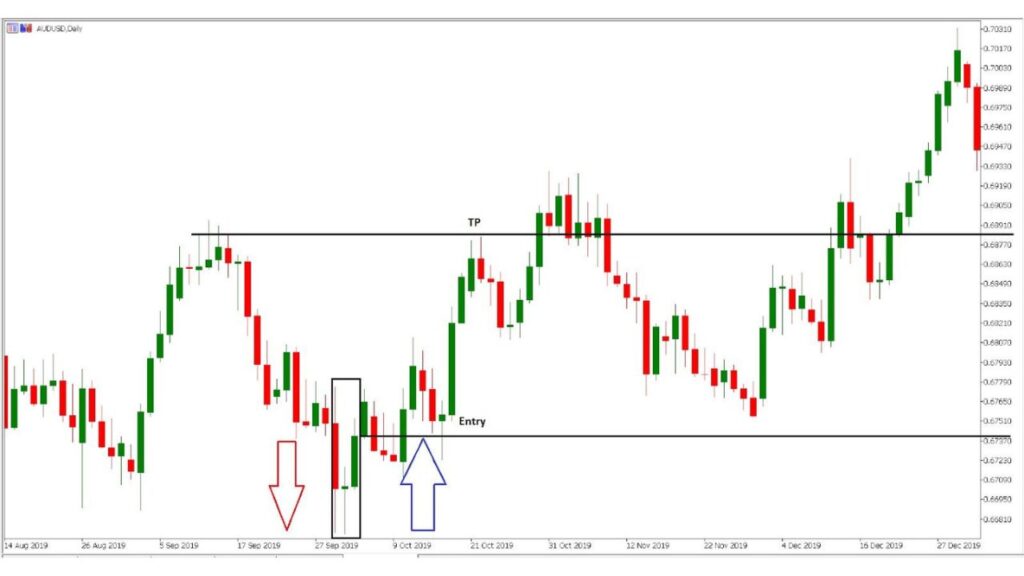
4. Engulfing Pattern:
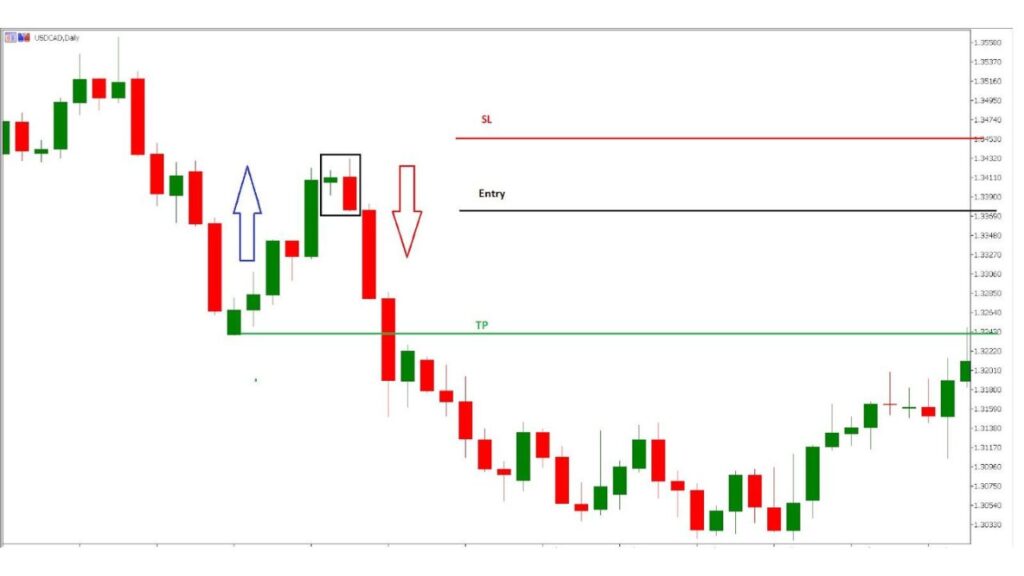
This two-candle pattern occurs when the body of the second candle completely engulfs the body of the first candle. A bullish engulfing pattern forms at the bottom of a downtrend and indicates a potential reversal to the upside, while a bearish engulfing pattern at the top of an uptrend suggests a potential reversal to the downside.
5. Morning Star/Evening Star:
These are three-candle reversal patterns. The Morning Star consists of a large bearish candle, followed by a small-bodied candle with a lower low and higher close (indicating indecision), and finally a large bullish candle. The Evening Star is the opposite and indicates a potential reversal to the downside.
6. Harami
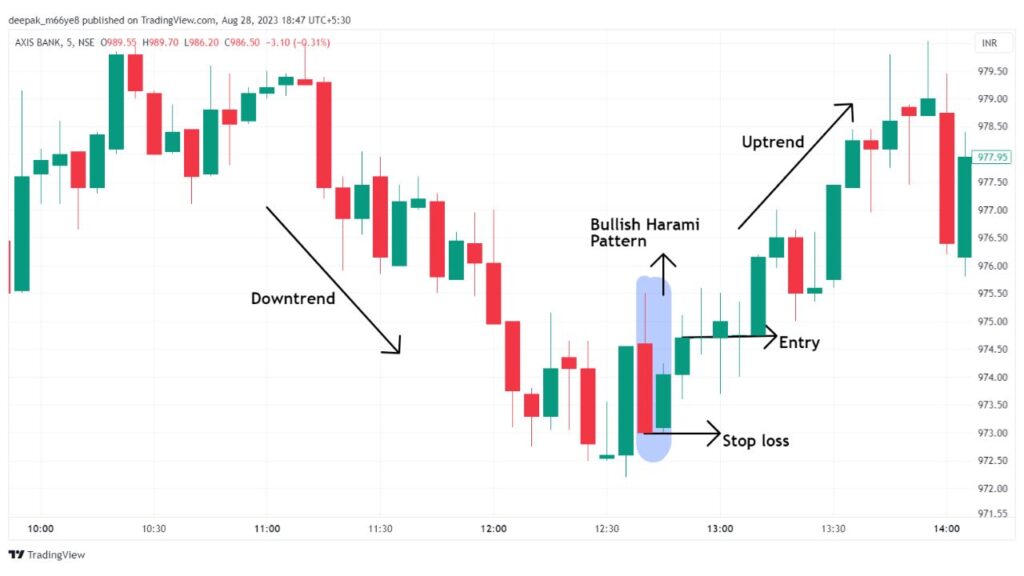
The Harami pattern consists of a large candle followed by a smaller candle whose body is within the range of the previous candle. It suggests a potential reversal.
7. Three White Soldiers/Three Black Crows:
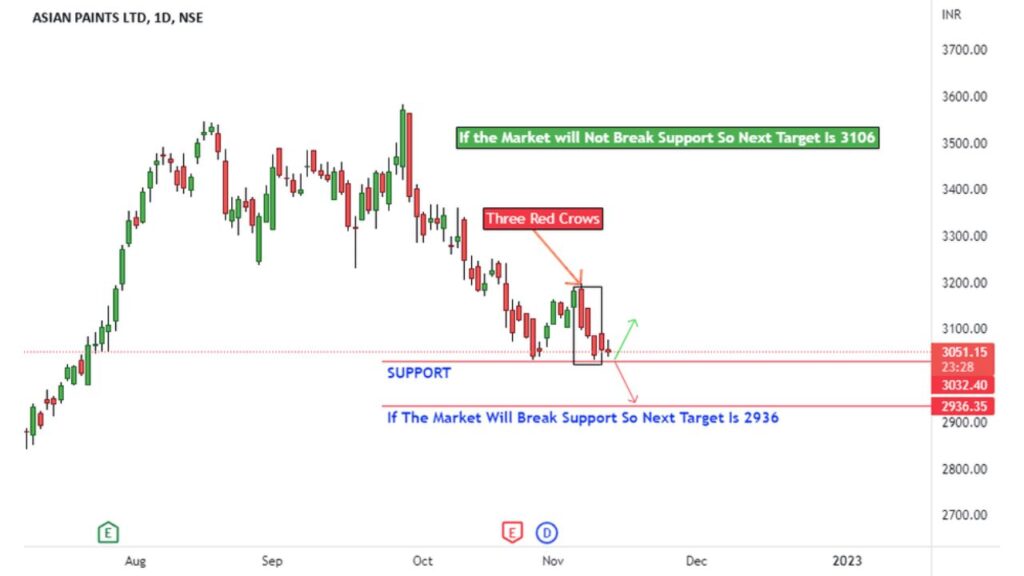
These are three-candle reversal patterns. Three White Soldiers occur during a downtrend and consist of three consecutive long-bodied bullish candles, signaling a potential reversal to the upside. Three Black Crows occur during an uptrend and consist of three consecutive long-bodied bearish candles, signaling a potential reversal to the downside.
Conclusion:
Candlestick patterns are powerful tools in a trader’s arsenal. By mastering these patterns and incorporating them into your trading strategy, you can gain a deeper understanding of market dynamics and improve your trading performance.
However, it’s essential to remember that no pattern guarantees success, and risk management is paramount. As a SEBI registered research analyst, I encourage you to combine candlestick analysis with fundamental research and proper risk management to navigate the Indian stock market successfully.
Happy trading!
—
For more insights and personalized guidance on trading in the Indian stock market, feel free to contact us at [Your Contact Information]. Stay tuned to our blog for the latest updates and analysis.
Disclaimer: This blog post is for informational purposes only and should not be considered financial advice. Please consult a qualified financial advisor before making any investment decisions.
Join our global community for expert trading insights, interactive learning, and a collaborative space to thrive in the financial markets.
Disclaimer
Investment in securities market are subject to market risks, read all the related documents carefully before investing
Contact Information
info@krishnapathak.com
Phone
+91 9883455700
Copyright © 2024 Krishna Pathak. All rights reserved.